Cation Exchange Capacity- Strong Ability of Zeolite

Natural Zeolite vs. Synthetic Zeolite,It was made by an aluminosilicate framework’s function of adsorbent and cation exchange capacity. zeolite clinoptilolite was made powdered,granules.

Cation Exchange and Cation Exchange Capacity

  • What are Cation Exchange and Cation Exchange Capacity?
  • Significance of CEC and BS
  • Percent Base Saturation
  • CEC and Fertility Characteristics of Domestic Soils
  • How CEC changes with Soil pH
  • Typical CEC Values in Soils
  • Calculating the Cation Exchange Capacity from a Routine Soil Test
  • Additional Resources and Reviewers

How to check cation exchange capacity of soil with zeolite

What are Cation Exchange and Cation Exchange Capacity?

Soil clay minerals and organic matter tend to be negatively charged, thus attracting positively charged ions (cations) on their surfaces by electrostatic forces. As a result, the cations remain within the soil root zone and are not easily lost through leaching. The adsorbed cations may easily exchange with other cations in the soil solution, hence the term “cation exchange.” The adsorbed cations replenish the ions in the soil solution when concentrations decrease due to uptake by plant roots.

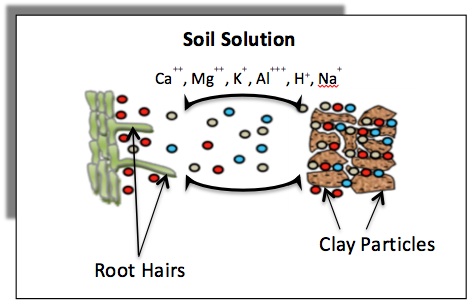
Cation exchange capacity (CEC) is a measure of the total negative charges within the soil that adsorb plant nutrient cations such as calcium (Ca2+), magnesium (Mg2+) and potassium (K+). As such, the CEC is a property of a soil that describes its capacity to supply nutrient cations to the soil solution for plant uptake. Figure 1 illustrates cations retained on soil clay minerals that can exchange with those in the soil solution. Plant roots can remove nutrients from the soil solution, which results in nutrients moving away from the clay particles. Addition of fertilizer to soil causes an initial increase in nutrient concentration in the soil solution, which results in nutrients moving toward clay particles.

The nutrient cations plants use in the largest amounts are potassium (K+), calcium (Ca2+) and magnesium (Mg2+). Other cations adsorbed on exchange sites are ammonium (NH4+), sodium (Na+), hydrogen (H+), aluminum (Al3+), iron (Fe2+ or Fe3+), manganese (Mn2+), copper (Cu2+) and zinc (Zn2+). Micronutrient cations such as zinc, copper, iron and manganese are typically present at very low concentrations in soils. Ammonium concentrations are also typically very low because microorganisms convert ammonium to nitrate in a process called nitrification.

How CEC changes with Soil pH

Figure 1. Schematic diagram showing exchange of cations between the soil surfaces and the soil solution, and the movement of these cations from soil solution to roots (rhizosphere) for uptake.

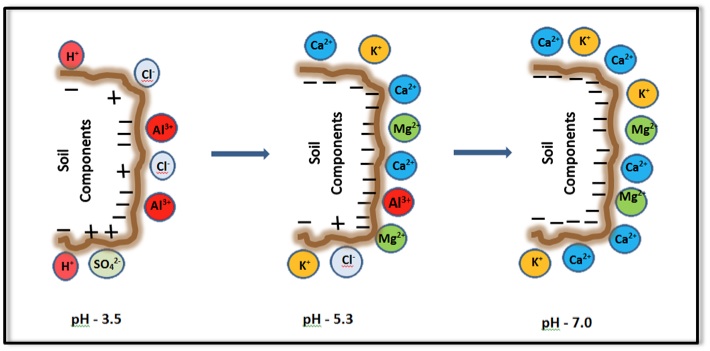
The CEC of soil organic matter and some clay minerals varies with pH. Generally, the CEC is lowest at soil pHs of 3.5 to 4.0 and increases as the pH is increased by liming an acid soil, as shown in Figure 2. Because CEC may vary considerably with soil pH, it is a common practice to measure a soil’s CEC at a pH of 7.0. Also note that some positive charges may occur on specific soil mineral surfaces at low pH. These positive charges retain anions (negatively charged ions) such as chloride (Cl-) and sulfate (SO42-).

soil CEC
Figure 1. Schematic diagram showing exchange of cations between the soil surfaces and the soil solution, and the movement of these cations from soil solution to roots (rhizosphere) for uptake.
soil CEC
Figure 2. Influence of pH on the surface charge of soil and its components.


Calculating the Cation Exchange Capacity from a Routine Soil Test

The CEC value included on typical soil testing laboratory reports is calculated by adding together the concentrations (expressed as milliequivalents of charge per 100 grams of soil) of potassium, magnesium, calcium, sodium and hydrogen, which are extracted from soils using an appropriate extraction method. 

The University of domestic Soil Testing Laboratory uses the Mehlich I procedure, based on a double acid (0.05 N HCl + 0.025 N H2SO4) extracting solution. This method is appropriate for acidic, low CEC soils, which are commonly found. The CEC of soils containing large amounts of clay or organic matter, or that are alkaline, cannot be satisfactorily analyzed using the Mehlich I extract. Other soil extraction methods should be used on these types of soils.


Typical CEC Values in Soils

In most soil reports, CEC is expressed as milliequivalents (meq) of charge (number of charges) per 100 grams of soil (meq/100 g or as cmol/kg when using International Scientific Units). 

The number of milliequivalents is used rather than a weight (pounds, grams, etc.) of adsorbed cations because CEC represents the total number of charges, which is a better standard of comparison of different soils because each cation species has a different weight and soils differ in the proportions of the different cation species.

Table 1 shows the typical cation exchange capacities of soil clay minerals and soils of various textures. Because soil is a mixture of different particle sizes (sand, silt and clay), clay mineral types and organic matter in various proportions, the dominant components and soil pH dictates the soil’s CEC.

Table 1. Cation exchange capacities at pH 7.0 of different soil types, textures and soil organic matter.
Soil and Soil ComponentsCEC (meq/100 g)
Clay Type 
Kaolinite3-15
Illite15-40
Montmorillonite80-100
Soil Texture 
Sand1-5
Fine Sandy Loam5-10
Loam5-15
Clay Loam15-30
Clay>30
Organic Matter200-400

CEC and Fertility Characteristics of Chinese Soils

For practical purposes,  soils are grouped into four major categories: (1) Coastal Plain, (2) Piedmont, (3) Mountain and Limestone Valley and (4) soils from landscapes, golf greens, greenhouses and flower beds. These categories make for easier evaluation of fertility. The chart below describes the CEC and general fertility characteristics of each soil group.

Soil GroupCEC and Soil Fertility Characteristics
Coastal Plain (includes Atlantic Flatwoods and Sand Hills)Soils have sandy surfaces and a CEC of 6 meq/100 g or less. Soils in their native state can be acid and infertile. Soils will vary in clay content, drainage characteristics and color. Soils will vary in productivity, ease of handling and adaptation to row crop production. Typical soil types are Norfolk, Lakeland, Lynchburg and Tifton.
Piedmont soilsSoils are predominately upland, well-drained red soils with a CEC of 6 to 12 meq/100 g. Soils in their native state are acid and low in phosphorus but higher in potassium than the Coastal Plain soils. Major soil series are Cecil, Madison and Davison.
Mountain and Limestone Valley soilsSoils may have a gray, sandy surface underlain with a heavy red sandy clay or clay texture soil. The alluvial terraces and river bottoms are gray to light brown in color with yellow to dark red sandy clay loam subsoil. Soils are acid and low in fertility. The average CEC value of these soils is 9 meq/100 g. The major soil types are Porters, Hayesville, Talladega, Fannin, Congaree, Clarkesville, Fullerton, Dewey and Decatur.
Soils from landscapes and golf greensThese soils are frequently maintained differently than crop soils and are usually artificially constituted and maintained. Many are erratic in fertility and cannot be easily placed in one of the three categories given above.

Percent Base Saturation

Percent base saturation (BS) is the percentage of the CEC occupied by the basic cations Ca2+, Mg2+ and K+. Basic cations are distinguished from the acid cations H+ and Al3+. At an approximate soil pH 5.4 or less, Al3+ is present in a significantly high concentration that hinders growth of most plant species, and the lower the soil pH, the greater the amount of toxic Al3+. Therefore, soils with a high percent base saturation are generally more fertile because:

They have little or no acid cation Al3+ that is toxic to plant growth.
Soils with high percent base saturation have a higher pH; therefore, they are more buffered against acid cations from plant roots and soil processes that acidify the soil (nitrification, acid rain, etc.).
They contain greater amounts of the essential plant nutrient cations K+, Ca2+ and Mg2+ for use by plants.
The percentage base saturation is expressed as follows:

%BS = [(Ca2+ + Mg2+ + K+)/CEC] × 100

Depending on soil pH, the soil’s base saturation may be a fraction of CEC or approximately equal to CEC. In general, if the soil pH is below 7, the base saturation is less than CEC. At pH 7 or higher, soil clay mineral and organic matter surfaces are occupied by basic cations, and thus, base saturation is equal to CEC. Figure 2 illustrates the relative amount of cations retained on soil surfaces at various soil pH levels.

Significance of CEC and BS

A soil’s CEC affects fertilization and liming practices. For example, soils with high CEC retain more nutrients than low-CEC soils. With large quantities of fertilizers applied in a single application to sandy soils with low CEC, loss of nutrients is more likely to occur via leaching. In contrast, these nutrients are much less susceptible to losses in clay soils.

Crop production releases acidity into soil. Soil pH will decrease more due to crop production on low CEC soils. High CEC soils are generally well buffered such that pH changes much less from crop production. Therefore, sandy soils low in CEC need to be limed more frequently but at lower rates of application than clay soils. Higher lime rates are needed to reach an optimum pH on high CEC soils due to their greater abundance of acidic cations at a given pH.

Zeolite is dense and better porous with a molecular sieve structure. The unique natural attributes act as an effective mineral sponge, Absorb more water, drawn in, and collected by the zeolite granular, once mixed into the soil it creates space for crop aeration. 

Additional Resources

Send Your Inquiry Today

Benefits of UZ-MIN Clinoptilolite Zeolite Granular